
 Colorblindness
Test
         Colorblindness
         Test
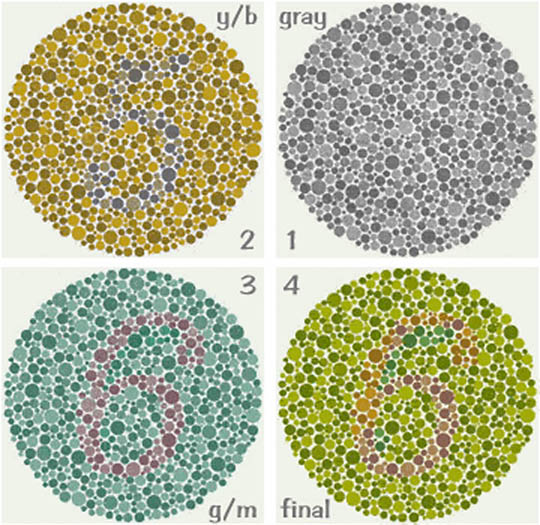
The above four charts represent a progression in the creation of a typical Dvorine and Ishihara style "colorblindness" tests. Chart 1 depicts the starting random-blob background pattern in monochrome. Chart 2 has the number "5" superimposed, using only colors lying along the Blue-Yellow axis of standard chromaticity color-space (as in the standard CIE diagram). Chart 3 similarly has the number "6" superimposed in colors lying along the axis at right angles to the previous, and thus contains only the range of hues from Green through Magenta. The normal eye can detect colors along both of these axis, which is to say, the whole color-space, so it can easily see both of these numbers.
Finally, Chart 4 combines both Charts 2 and 3, while maintaining the two axes, now added together. The brightness of the blobs has been chosen so that the normal eye will mainly see the number "6" and ignore the subtle color shifts (caused by the presence of the "5") that depart from the expected "6" shape. For eyes having the most common "red-green" form of color blindness (or significant red-green anomalous color vision), just the number "5" will be seen. This is because only colors lying along the Blue-Yellow axis can be detected when either the red or green retinal pigments are missing (or too similar to one another). Several overlapping and related charts can quickly determine which specific deficiency of the cones, if any, is present.
Wendy Carlos,
Colortest
©
2007-08 Serendip LLC. No images, text, graphics or design
may be reproduced without permission. All Rights
Reserved.
![]()